

How to Debug Better with Chrome

I’m a frontend developer who cares deeply about building websites that not only look good but feel effortless to use. I enjoy turning design ideas into clean, responsive, and intuitive interfaces using tools like React, Next.js, JavaScript, HTML, and CSS. My goal is always the same — create experiences that make users feel understood and help brands stand out for the right reasons.
Alongside development, I’ve built a strong track record as a technical writer. I’ve written 50+ articles, tutorials, and product guides that simplify complex topics for developers and teams. Many of them rank on Google’s first page and are featured by leading tech companies — something I take real pride in.
I’m driven by curiosity, clarity, and craft. Whether it’s refining a UI flow or breaking down a technical concept into something actionable, I care about getting the details right and delivering real value.
If you’re looking for someone who blends strong frontend expertise with clear communication and technical storytelling — let’s connect.
Has your JavaScript ever failed to execute correctly and you struggled to figure out why? Has your CSS ever behaved strangely and you struggled to figure out why or get it to display as intended? Debugging is a fundamental component of programming and an essential skill for all software developers.
As you build websites and applications, you soon realize that debugging takes up a lot of time. Hence, learning the basics and advanced features of any tool that can help you troubleshoot your web applications more efficiently will make you a better debugger.
To be a better debugger, you must become familiar with the right tools that make debugging easier. This article focuses on some best practices, key features, and tips for troubleshooting your web applications more easily with Chrome DevTools.
What is Google Chrome DevTools?
Google Chrome is probably the most widely used and popular web browser among developers because it stands out from the rest. It has gradually become the preferred web browser for most developers to test and debug their websites and web apps. Google Chrome provides developers with the ability to debug most web applications with the built-in developer tools (aka DevTools) within the browser, without the need for third-party debugging tools.
There are several features and tools available in Google Chrome's developer tools that enable developers to edit their code directly in the browser, test and add breakpoints to detect issues, and debug their code more efficiently.
Quick View of the DevTools Panel
To access the DevTools press Control + Shift + C (on Windows or Linux) and Command + Option + C (on Mac). Additionally, you can right-click on any part of a webpage, choose "inspect element", or access it through the options menu.
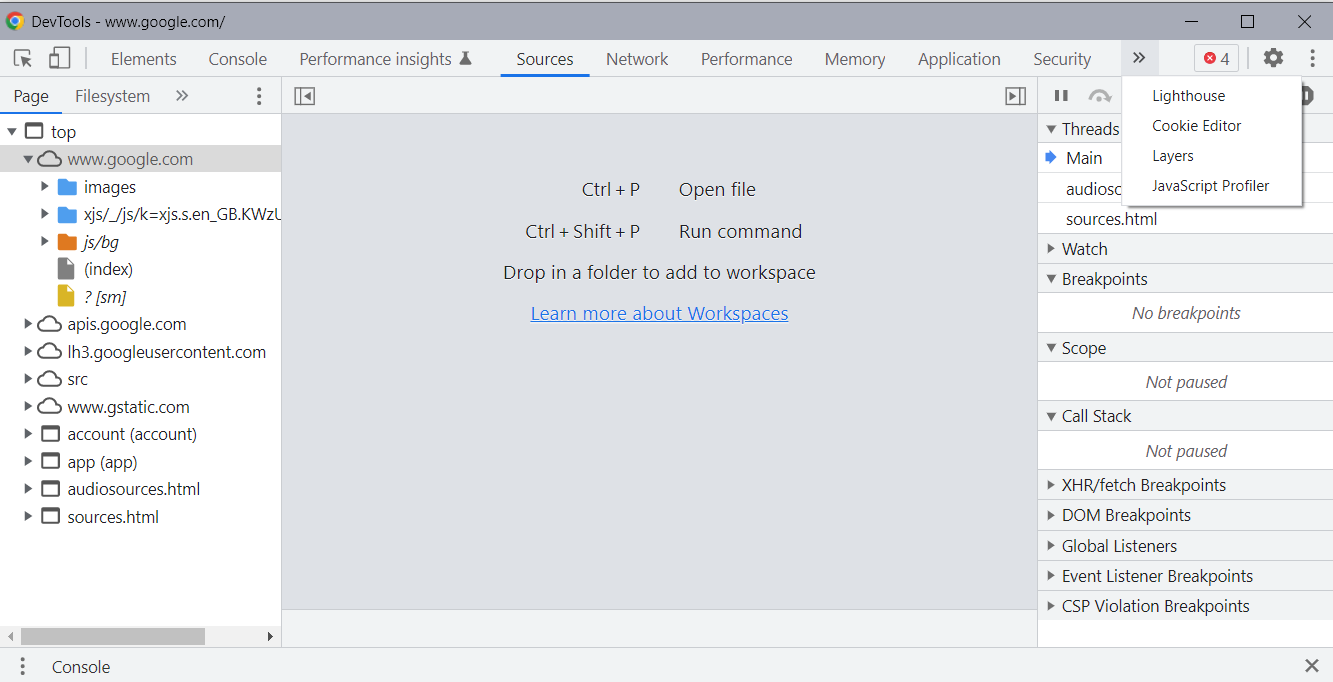
Google's Chrome DevTools window shows a few quick tabs at the top when opened in a mini-window, plus a few additional hidden tabs that are accessible by clicking the >> symbol next to them or switching to a full-screen view.
A brief summary of the responsibilities of each panel:
- Elements: Here DOM nodes and style attributes can be inspected and edited.
- Console: JavaScript code can be viewed and run via the console.
- Sources: The source code is available here. You can debug JavaScript code and add breakpoints, etc.
- Network: Debug network-related activities. You can view and monitor the network.
- Performance: Analyze speed and optimize performance.
- Memory: Fix memory-related issues by tracking memory usage.
- Application: You can check sessionStorage, localStorage, IndexDB, cookies, as well as other application-related data files.
- Security: Debug certificate issues and other security concerns.
- Lighthouse: Lets you audit the app's performance, accessibility, SEO, etc.
monitor(function) - Monitor a Function
There are a few console utility APIs available in Chrome that provide convenient functions for common debugging tasks. The monitor() function, as the name suggests, is one of such console functions that is used to monitor a specific function to know when that function is called and what arguments are passed to that function when it is called.
The target function has to be passed to the monitor() function as an argument for it to observe the specified function for any call. Once called, a message is immediately logged to the console with the function name, along with its arguments, indicating that the function has been called.
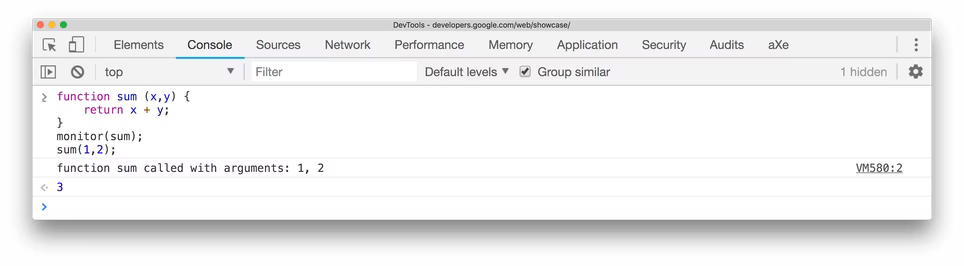
Using the unmonitor() function will cancel monitoring of that function.
monitorEvents() - Monitor DOM Object Events
This function is used to monitor an object in the DOM for a specific event or events. When this event is triggered on the specified object, the function immediately outputs the event and the object to the console.
The Event object will be logged to the console when any of the specified events occur on the specified object. The events to be monitored can be a specific event, an array of events, or generic event "types" mapped to predefined collections.
This function receives the object that should be monitored and the specific event i.e monitorEvents(object [, events]). For example, to monitor the window object for any resize event:
monitorEvents(window, "resize");
Output:
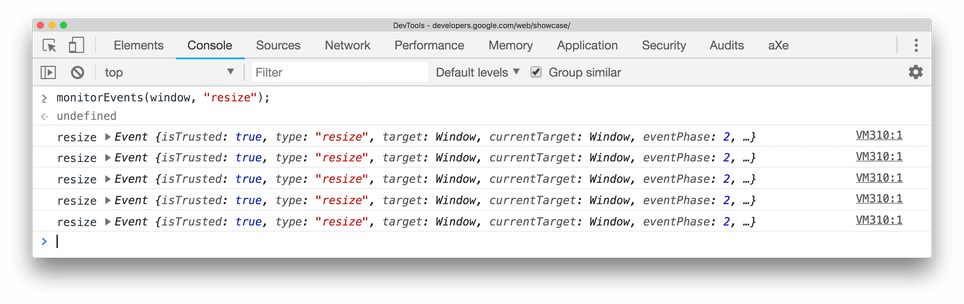
You can selectively stop monitoring specific events on an object i.e. unmonitorEvents(object[, events]), or all events on an object i.e. unmonitorEvents(window).
To learn more about this function, visit the docs.
table() - Outputting Array as Table
When fetching data from a database or external API, it typically comes as an array of objects. Imagine you're trying to preview or read this returned data in your chrome console to figure out something that is not working in your app. The console.log() function typically displays it as textual output that can prove difficult to read or sort through.
You obviously want to see all the items, properties, and their associated attributes in an organized manner that is easier to read. You can accomplish this in your chrome console using table() function i.e. table(data). This method prints and organizes the information in a tabular format that is more human-friendly, and easier to read and understand.
For example:
const users = [

    { first: "Rene", last: "Smith" },

     { first: "Chaim", lastName: "Soutine", birthday: “18930113” },

    { first: "Henri", lastName: "Matisse",},

];

table(users);
Output:
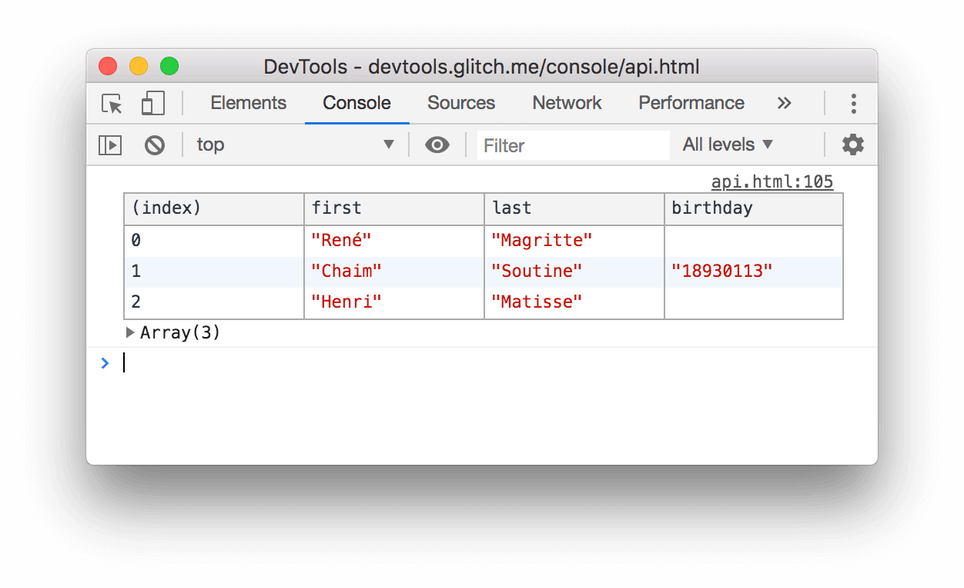
Note: A similar result can be achieved using console.table().
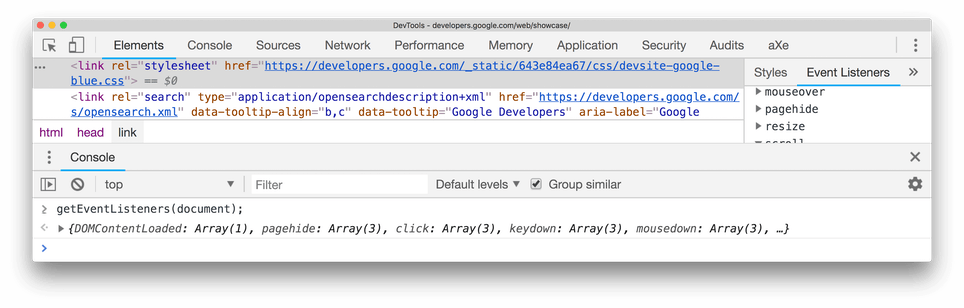
getEventListeners() - Get Event Listeners
Calling the getEventListener function with a DOM object passed to it as an argument returns all the events registered on that specific object. The returned value is an object containing an array for each event type registered (such as clicks, keydowns, etc.). Each member array contains all the events of that event type and can be expanded to explore their respective properties, such as the associated function they fire.
debug() - Debug a Function
In order to fix a page, functionality, or component that does not behave as expected, you usually add a "debugger;" statement to the function's declaration to activate a debugger and try to understand what is wrong with it.
This would, however, require you to manually go into your source code to add these debugger statements. Chrome lets you do this right from the console without having to access your source code with the use of the debug() function. Simply call it in the console and pass the function's name to it, and it will automatically inject a debugger into the function, allowing you to step through the code to debug it.
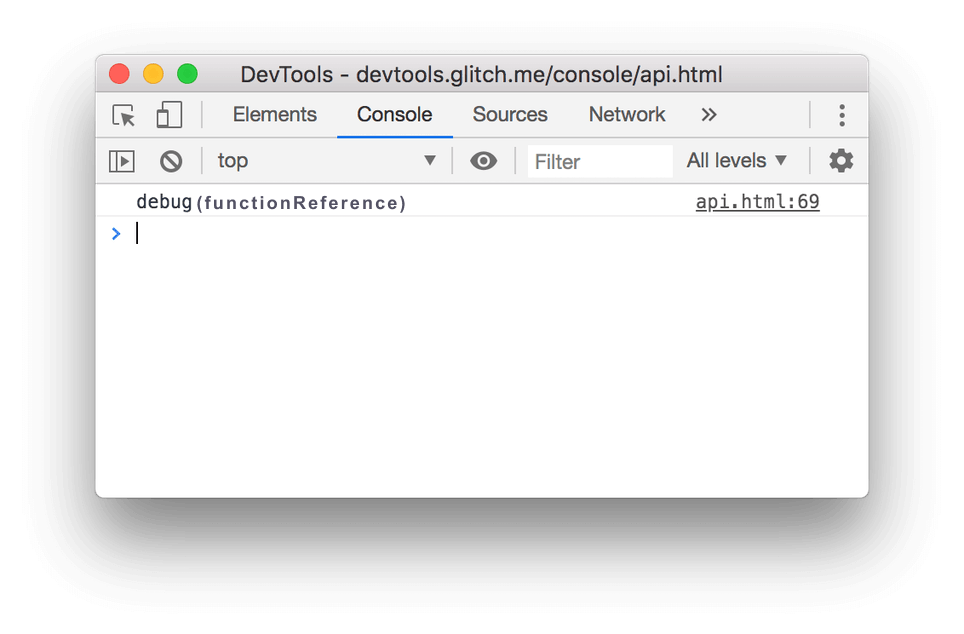
Calling debug(functionReference) in the console adds a debugger; statement on the first line of the referenced function's declaration.
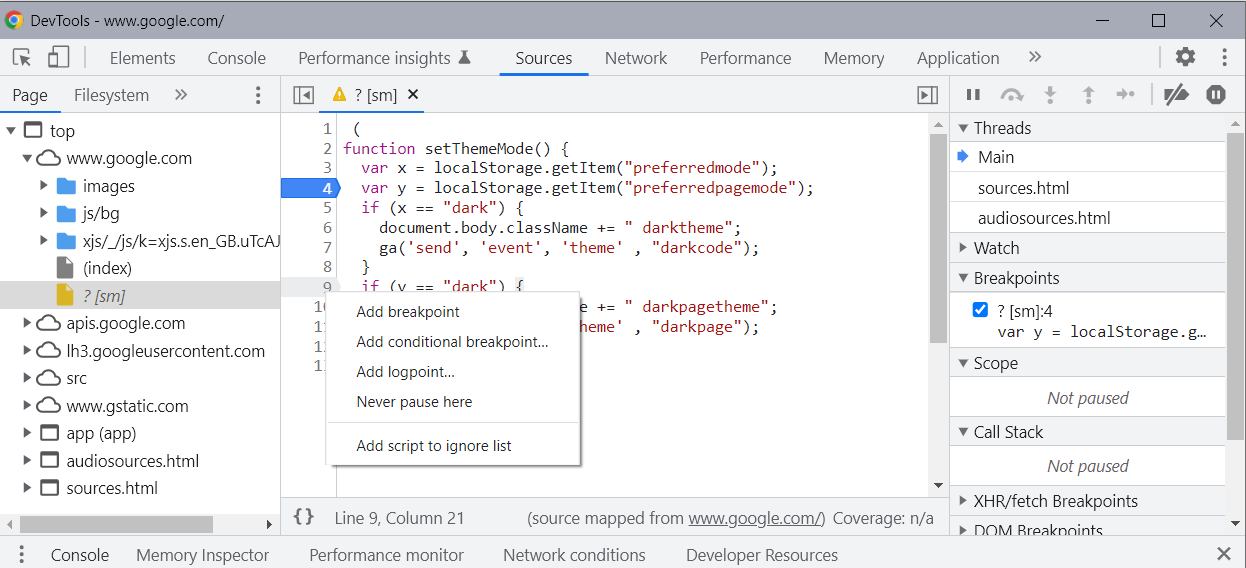
The DevTools also offer breakpoints to let you step through your code line-by-line. You can add them by clicking the line number in the Sources panel. Left-clicking will automatically add a breakpoint, while right-clicking on a number lets you set a conditional breakpoint, which can be very useful for debugging loops.
To disable all breakpoints in the function, use undebug(functionReference), or use the source panel.
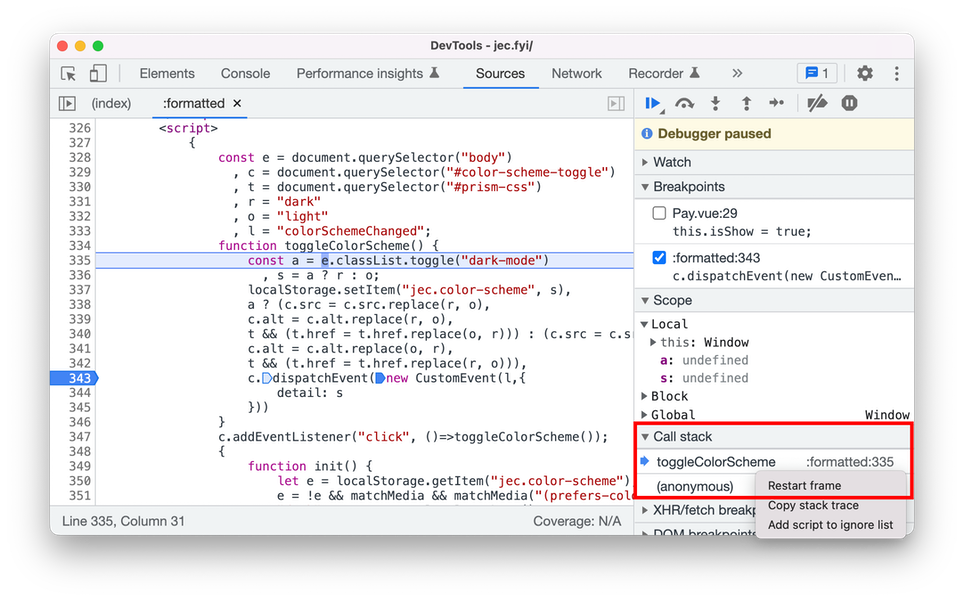
Restart frame during debugging
With Chrome's newly added DevTools Restart Frame feature, you can re-run the preceding code after hitting a breakpoint while debugging a function. This means you can re-run the preceding code right after being paused somewhere in the function.
As a result, you can travel through time within your current call stack (though to a limited extent).
Note: The state is not restored when you use Restart Frame Chrome. The execution pointer is simply moved to the top of the function.
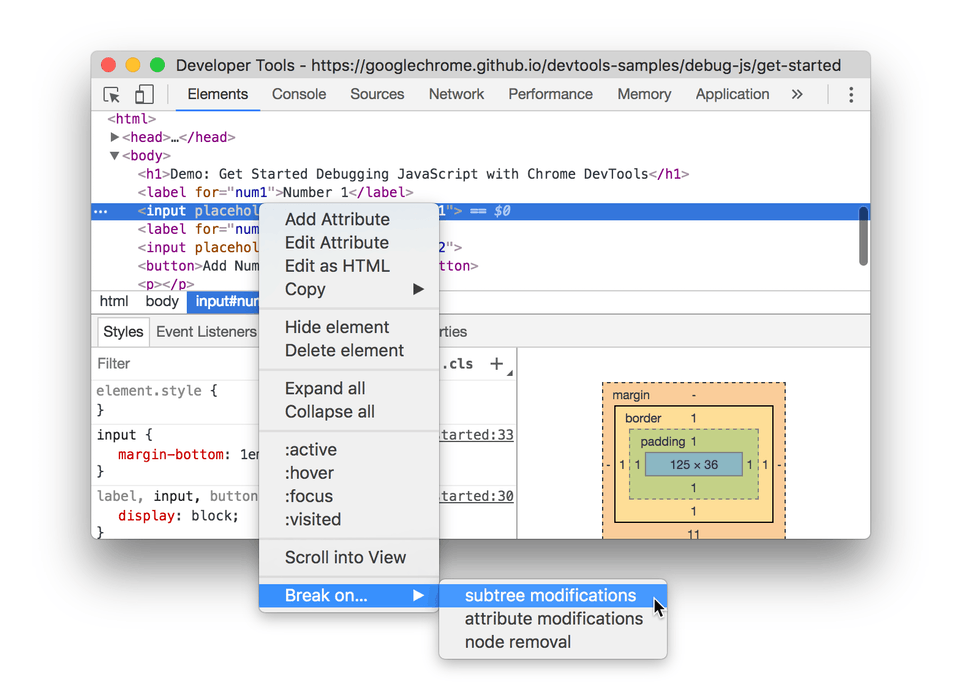
Add BreakPoint on DOM Element (Attribute/Template Change)
There may be times when you need to place a breakpoint or debugger on a DOM element that changes conditionally or dynamically.
You can easily modify a DOM element by right-clicking on the target DOM element and selecting 'Break on' -> 'Attribute modification'. Additionally, there are also some other options you experiment with.
Code Snippets
While debugging, you may constantly have the need to execute the same line of code over and over again until you're done troubleshooting. This would, however, result in you doing a lot of repetitive typing or constantly having to copy and paste from your favorite code editor to your Chrome browser console.
Google Chrome DevTools has a snippet feature that allows you to save a code snippet so it can be used whenever the need arises. A snippet is a piece of JavaScript source code that you can save and reuse for debugging purposes. The created snippet can be executed at any time with the click of a button, on any website, at every debugging session as it is permanently saved until manually deleted. This saves you time typing in repetitive information on every page test.
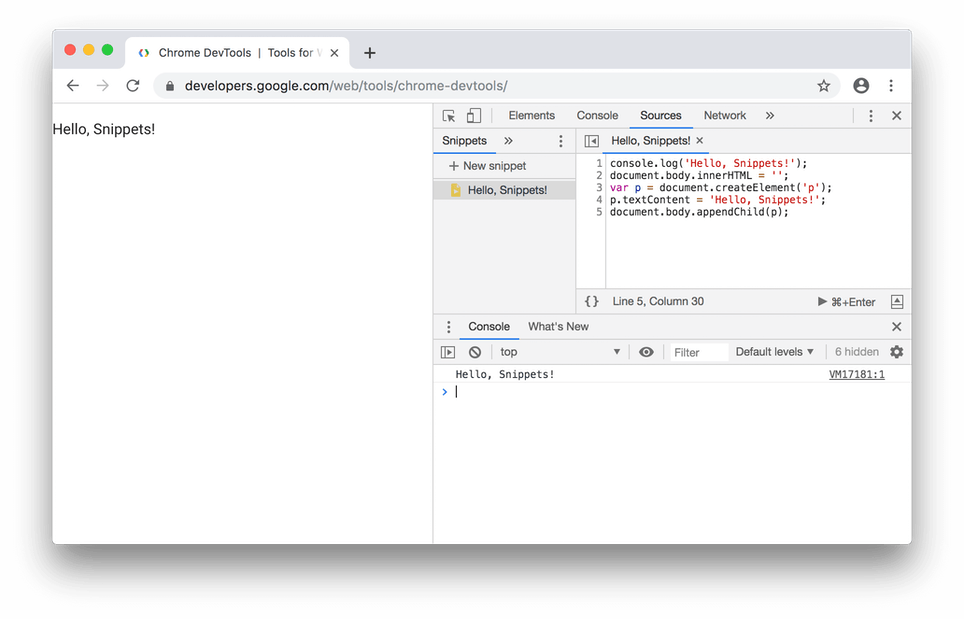
To Create a Code Snippet in Chrome:
- Open the DevTools window and click on "Source" in the tabs panel.
- Click on the >> symbol, select "snippets" and then New snippet.
- Give it a name and write your code snippet.
- Save the file.
- Now you can execute the code on any web page by right-clicking on the snippet file name and selecting "run.”
Conclusion
There is no doubt that Chrome DevTools is an excellent addition to the developer's toolbox. In this post, we examined how you can improve your debugging skills by debugging directly in the browser using Google Chrome's DevTools. Hopefully, this will enable you to be more productive in troubleshooting your web apps and components.
Nonetheless, that's only a small fraction of the many features available in Google Chrome's DevTools. What other tools and tricks do you use? Let us know what other amazing DevTools features you know about in the comments section below.


